Tracking a new year's resolution with F# and FSharpChart
Jan 15, 2013This year, I have a goal of running 500 miles. That’s not a crazy-ambitious goal, but between work, school, hobbies, friends, and (occasional) downtime, I think it’s plenty for me. In contrast, the CEO of RunKeeper is planning to run 1,500 miles this year! That’s an admirable goal, and I hope he succeeds (though I would prefer that he focus on releasing a Windows Phone app, instead. Ah well…).
In order to stay motivated (and because it’s cool) I have decided to track my runs and chart my progress throughout the year. Excel works just fine for this, but I want to try something a little different. Why not use this as an opportunity to use FSharpChart?
My charts should show the following:
- A series representing total miles run
- A series representing the goal pace for hitting 500 miles
- A series showing miles run on a daily basis
The run data themselves are kept in a simple text file, each line of which contains a date stamp and the number of miles I logged that day. For now I am just updating this file manually, but I have plans to start populating it dynamically by pulling my run info from Endomondo (which has great Windows Phone and Windows 8 apps). They don’t have a public API, but you can scrape your data from the HTML of their embeddable widgets.
My F# solution has 2 functions - one for grabbing my run data from a file (or wherever else I might want to grab them from), and one for generating the chart from the data:
open System
open System.Drawing
open System.IO
open System.Windows.Forms.DataVisualization.Charting
open MSDN.FSharp.Charting

// parse date and distance info from file
let getRunData path =
    File.ReadAllLines(path)
    |> Array.map (fun line ->
        match line.Split([|' '|], StringSplitOptions.RemoveEmptyEntries) with
        | [| date; dist |] ->
            (DateTime.Parse(date) , float dist)
        | _ -> failwith "Unable to parse line")

// plot total progress, daily distance, and goal progress
let makeRunChart (runData : (DateTime * float) array) goal =
    let lastDate = fst (runData.[runData.Length - 1])
    let endDate =   // only chart up to the end of the current month
        DateTime.MinValue.AddYears(lastDate.Year - 1).AddMonths(lastDate.Month).AddDays(-1.)
    let startDate = DateTime.MinValue.AddYears(lastDate.Year - 1)
    let dailyGoal = goal / 365.  // not worrying about leap years, I know...

    // small series representing first and last day at goal pace
    let goalPts =
        let totalDays = (endDate - startDate).TotalDays + 1.
        [(startDate, dailyGoal); (endDate, dailyGoal * totalDays)]

    // convert input list of daily distances into a list of cumulative distance
    let sumPts =
        let sum = ref 0.
        runData
        |> Array.map (fun (date, dist) ->
            sum := !sum + dist
            (date, !sum))

    // column chart of daily runs
    let runChrt =
        FSharpChart.Column (runData, Name = "Daily miles run")
        |> FSharpChart.WithSeries.Style (Color = System.Drawing.Color.Gray)
        |> FSharpChart.WithSeries.AxisType (YAxisType = AxisType.Secondary)

    // line chart of total progress
    let progressChrt =
        FSharpChart.Line (sumPts, Name = "Total miles run")
        |> FSharpChart.WithSeries.Style (Color = System.Drawing.Color.Red, BorderWidth = 4)
        |> FSharpChart.WithSeries.Marker (Style = MarkerStyle.Circle, Size = 7)

    // line chart of goal progress
    let goalChrt =
        FSharpChart.Line (goalPts, Name = "Target miles")
        |> FSharpChart.WithSeries.Style (Color = System.Drawing.Color.LightSteelBlue, BorderWidth = 4)

    // complete chart
    FSharpChart.Combine [runChrt; goalChrt; progressChrt]
    |> FSharpChart.WithArea.AxisX (Minimum = startDate.ToOADate(), Maximum = endDate.ToOADate(), MajorGrid = Grid(Enabled = false))
    |> FSharpChart.WithArea.AxisY (Title = "Total miles", TitleFont = new Font("Calibri", 11.0f), MajorGrid = Grid(LineColor = System.Drawing.Color.LightGray))
    |> FSharpChart.WithArea.AxisY2 (Title = "Daily miles", TitleFont = new Font("Calibri", 11.0f), MajorGrid = Grid(Enabled = false), Maximum = 10.)
    |> FSharpChart.WithTitle (Text = (sprintf "%.0f Miles in %d - Progress" goal lastDate.Year), Font = new Font("Impact", 14.0f))
    |> FSharpChart.WithLegend (Font = new Font("Calibri", 10.0f))
    |> FSharpChart.WithCreate
The results are very nice (my actual progress as of 1/15/2013):
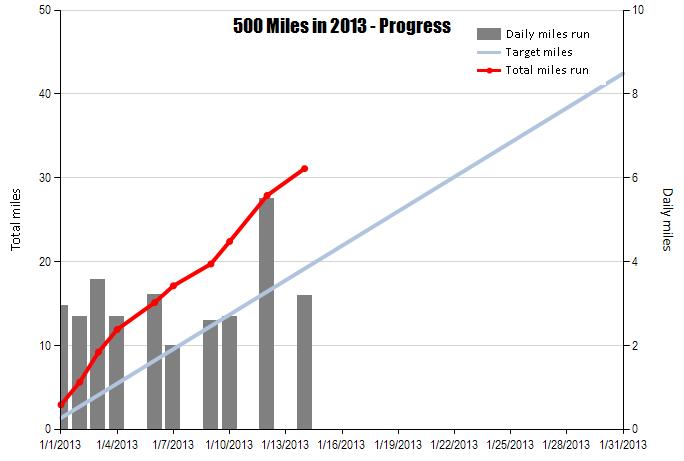
FSharpChart makes the chart generation pretty darn easy. The code could even be quite a bit smaller, but I chose to add a lot of tweaks to colors, fonts, sizes, etc so that the output matched just what I wanted.
This will also scale the chart such that the time axis only runs up to the end of the month in which the last run is logged. With only a handful of January runs, charting the entire year resulted in a bunch of empty space.
The resulting chart object can be saved as an image using the SaveChartAs method. Then, using code from my previous blog entry, I can post the image and a quick status update to Twitter.
let path = "C:\\runs.txt"
let chartPath = "C:\\progresschart.jpg"
let yearlyGoal = 500.
let twitterSettings = { ... }

let chrt = makeRunChart (getRunData path) yearlyGoal
chart.SaveChartAs(chartPath, CharImageFormat.Jpeg)

postToTwitter twitterSettings "Running!" (Some(chartPath))
Expect to see quite a few of these guys over the course of the year! Kudos to Carl Nolan for his work on FSharpChart.