Response to "Little Performance Explorations: F#"
Sep 21, 2014I recently saw a tweet from Ryan Riley linking to an article exploring F# performance and floating point processing:
This blog post highlighted some perf issues (minor) in #fsharp that surprised me. http://t.co/D2Q6ZtorhW Anyone able to explain?
— Ryan Riley (@panesofglass) September 18, 2014
I poked around the code and tested it a bit myself, and figured I would take up the author’s call for feedback. Comments on the original blog are locked down, so I’ve written up my results here, instead.
Initial measurements
Unless otherwise stated, all timings are with F# 3.1.2, VS 2013, Release build configuration, targeting x64, running on Windows 8.1 with .NET (not Mono, as the original author used).
Original, non-inlined code: 1653ms.
With inlining, as described: 1350ms, (18% improvement)
Fully imperative approach: 861ms (another 36% improvement)
These results line up pretty well with what the author is seeing.
For completeness, here are the implementations of convert that I am using. Note that the author does not give complete code for his imperative approach, but from his description I believe this is accurate.
let mapi' f (a:'T[]) =
    for i in 0..a.Length-1 do a.[i] <- f i a.[i]
    a
let convertOrig() =
    seq { for n in 0 .. nTraces-1 -> fileHeaderLength + n * traceLength + headerLength }
    |> Seq.fold
        (fun (samples:float32[]) traceOffset ->
            samples |> mapi' (fun i s -> s + ToIeee(IbmFloat32(readBigEndianInt32 buffer (traceOffset + i*4)))))
        (Array.zeroCreate nSamples)
    |> ignore

let convertImperative() =
    let samples : float32[] = Array.zeroCreate nSamples
    for n in 0 .. nTraces-1 do
        let traceOffset = fileHeaderLength + n * traceLength + headerLength
        for i in 0 .. nSamples-1 do
            samples.[i] <- samples.[i] + ToIeee(IbmFloat32(readBigEndianInt32 buffer (traceOffset + i*4)))
More tweaks
Given that he explored inlining other parts of the code (to great effect), I’m a bit surprised the author didn’t try marking mapi' as inline:
let inline mapi'' f (a:'T[]) =
    for i in 0..a.Length-1 do a.[i] <- f i a.[i]
    a
let convertInlineMapi() =
    seq { for n in 0 .. nTraces-1 -> fileHeaderLength + n * traceLength + headerLength }
    |> Seq.fold
        (fun (samples:float32[]) traceOffset ->
            samples |> mapi'' (fun i s -> s + ToIeee(IbmFloat32(readBigEndianInt32 buffer (traceOffset + i*4)))))
        (Array.zeroCreate nSamples)
    |> ignore
Simply inlining this little function results in another nice improvement: the functional version speeds up to 1002ms, erasing more than half of the remaining perf delta.
That seems like a pretty dramatic difference, considering we just inlined one function. All we did was “remove one function call per iteration,” right? Actually, the biggest difference is that we removed a lot of object allocations:
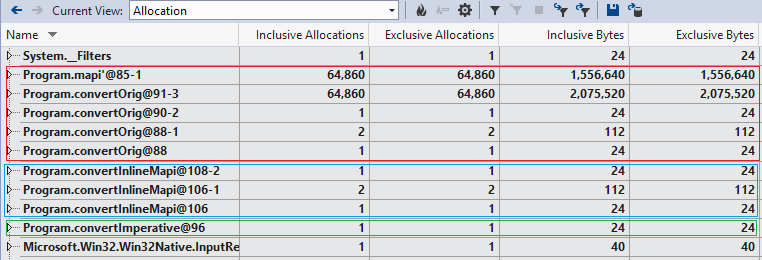
Running under a profiler, we see that the original approach results in roughly 2*nTraces allocations: for each of the nTraces iterations of the fold, there is an allocation of the class representing mapi', and of the class representing the lambda passed to mapi'. That’s about 130K allocations! With mapi'' inlined, the compiler arranges things much differently, and we see that there are only a few up-front allocations. The imperative approach requires has even fewer, still. It seems clear that this is a major contributor to the perf differences seen here.
What if we plucked out mapi' altogether, and just did a simple loop within the fold? This eliminates the use of the mapi' function, and the use of a lambda function:
let convertNoMapi() =
    seq { for n in 0 .. nTraces-1 -> fileHeaderLength + n * traceLength + headerLength }
    |> Seq.fold
        (fun (samples:float32[]) traceOffset ->
            for i in 0..samples.Length-1 do
                samples.[i] <- samples.[i] + ToIeee(IbmFloat32(readBigEndianInt32 buffer (traceOffset + i*4)))
            samples)
        (Array.zeroCreate nSamples)
    |> ignore
This variation of the code (which is admittedly more imperative, but still uses Seq, a comprehension, and fold) runs in 848ms, just as fast as the fully-imperative approach.
So what’s different this time? The allocation profile is the same as convertInlineMapi. If you compare the generated IL from convertInlineMapi and convertNoMapi, the difference is simply 1 function call: convertInlineMapi ends up in a for loop that calls a method (representing the lambda function), convertNoMapi distills to one giant for loop with its guts consisting of that same code, inline.
It isn’t totally clear to me why simply encapsulating a block of code in a method call would make a noticeable difference here. That method call is on the primary hot path, though, being executed nTraces*nSamples = 97,354,860 times. Interestingly, the difference is somewhat minimized if we change to compiling x86 - convertInlineMapi: 1056ms, convertNoMapi: 985ms.
Adding to the mystery, if we go back and remove the original inlining (of ToFloat32, ieeeOfPieces, and ToIeee), we find that the tweaked functional approaches begin to markedly outperform the imperative approach! convertOrig: 1649ms, convertImperative: 1274ms, convertInlineMapi: 1184ms, convertNoMapi: 1063ms.
My attempts to create isolated microbenchmarks to track these down ended up being fruitless - as often happens with low-level performance investigations, seemingly minor changes would result in dramatic behavior swings. At this point, I don’t think I have the necessary JIT and hardware optimization knowledge to make any meaningful further claims.
Overall, it’s nice that F# gives you tools like “inline”, “mutable”, imperative loops, etc for when you need them, but still maintains a strong emphasis on functional-style code.
You can find the full source code I used here, full credit to the original author for the majority of it.